Exposure & Light
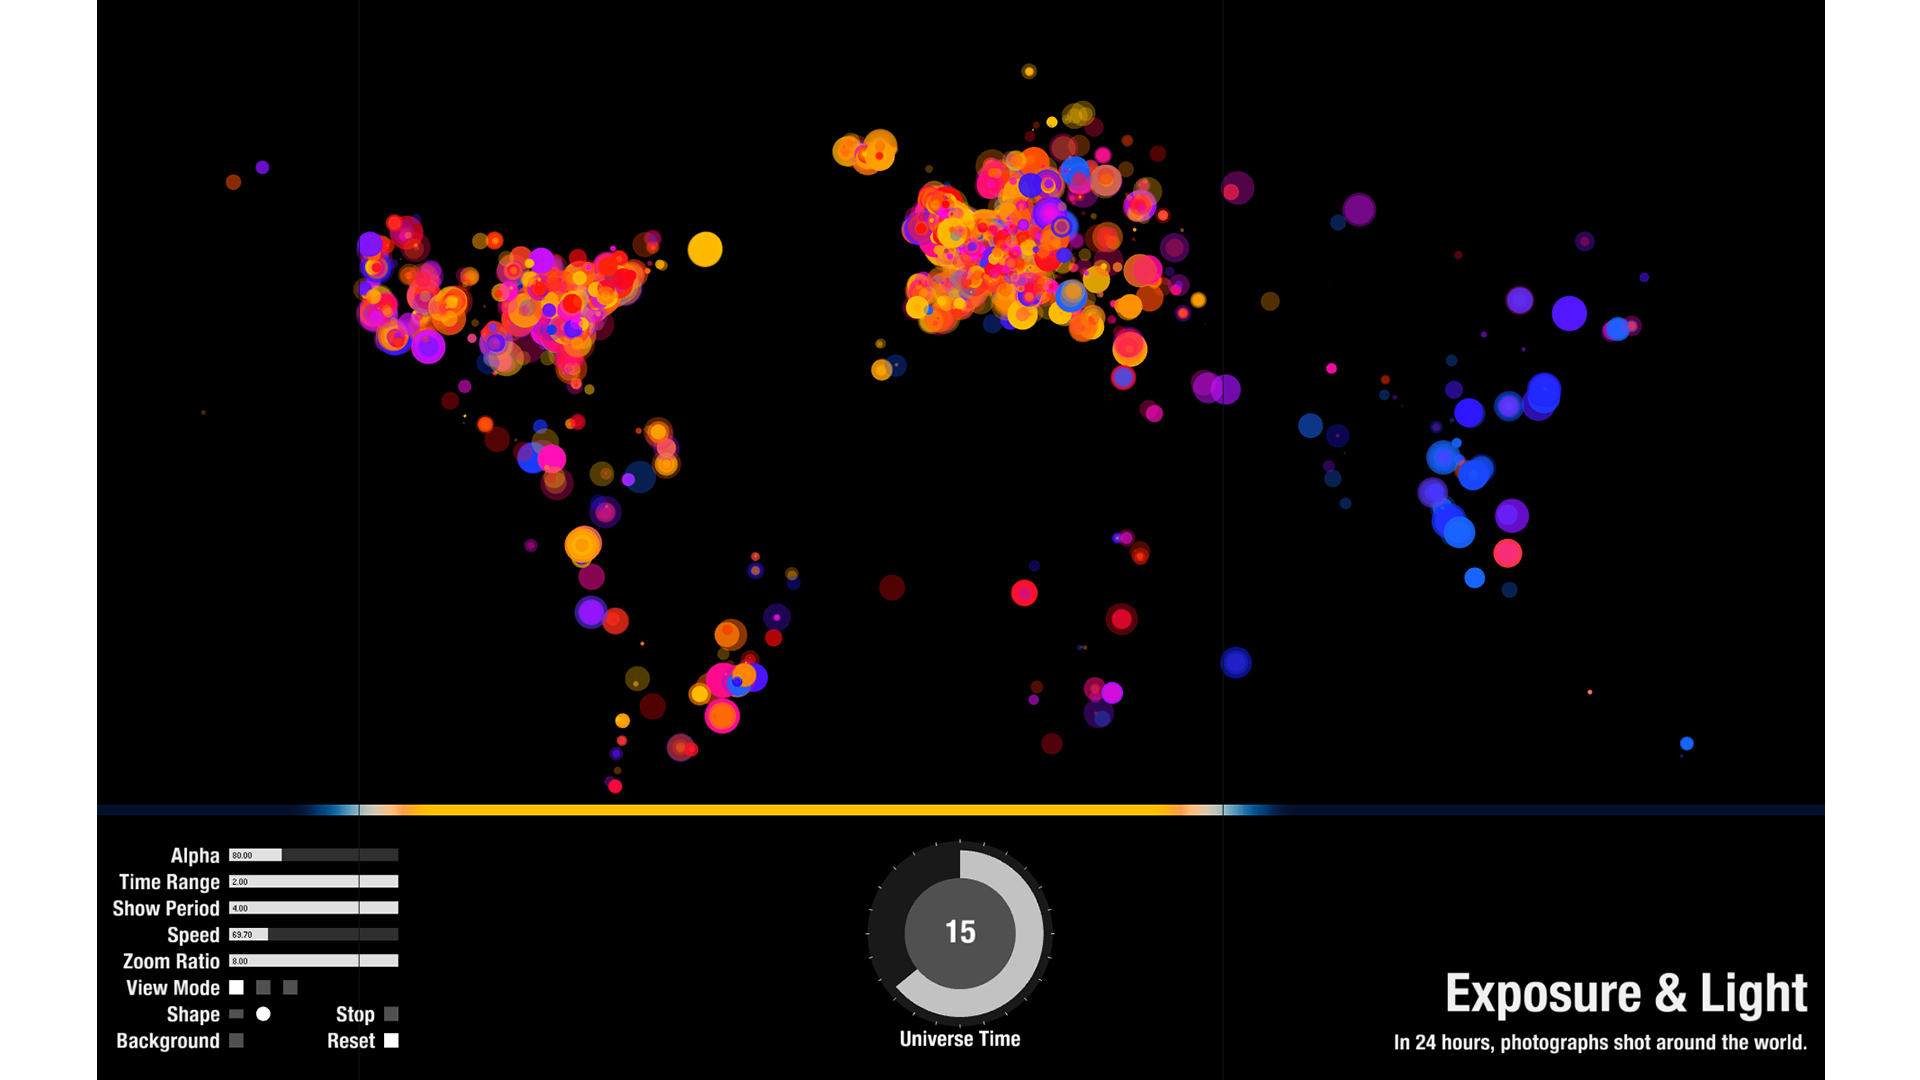
“Exposure & Light” is a data visualization project consisting of 200,000 photographs retrieved from Flickr taken over a 24-hour period.The photographs are arranged on a world map based on their EXIF data including geographic location, shooting time, camera settings such as aperture, exposure time, and ISO. Each photograph is represented as a rectangle, placed according to its geographic location, whose color is determined by its exposure value ranging from blue through red to yellow. Images with low exposures are colored blue increasing through red, orange, to yellow for high exposures.The animation cycles through the hours of the day. Photographs become visible based on their specific time-zone stamp. Users can control the time wheel to switch between different times. Also, users can see the actual photos by rolling over each colored rectangle.
